Posted on Fri 30 October 2015 in Python Projects
Letter Frequency using Python
This project can be found at the GitHub repository, including the IPython notebook.
Introduction
In this program, we look at parsing a large piece of a text file and analysing the character frequency using Python. This is typically called as the letter frequency. See this detailed explanation. After parsing through the text, we store each alphabet and its respective count in the form of a Python dictionary. Subsequently, we sort the dictionary both in alphabetical order as well as count order. These are then plotted as a bar chart which gives an idea about the frequency of the character in the English language written text.
import string
import matplotlib.pyplot as plt
Here, we import two modules, namely, string and matplotlib. The string module has a number of constants and classes which can be used to obtain the required ASCII characters. These characters can then be used as strings to check against the text that is to be parsed. For example, the text file may contain characters such as (, -, ", ., ~ which is of no interest for generating the letter frequency since only the alphabets are taken into account.
pd = string.punctuation + string.digits
lettersDict = {}
In the above line, we combine two string classes to obtain a single variable pd which contains both the punctuation and the digits characters. This is followed by creating an empty dictionary which will later be used to store the values and counts of the letters.
with open(text, 'r') as textfile:
    for line in textfile:
        line = line.strip()
        line = line.translate(None, pd)
        line = line.lower()
        letters = list(line)
        for letter in letters:
            if not " " in letter and not "\t" in letter:
                lettersDict[letter] = lettersDict.get(letter, 0) + 1

 Enter the file name: intro.txt
The text file for parsing is opened and processed line by line using the for loop. Firstly, the leading and trailing spaces are removed using the strip() method and then using the translate method, the text is translated excluding the strings present in the variable pd. The translated text now contains only the alphabets which are then converted to a list. At this point, the code has not checked for the presence of any spaces or tabs in the text. We check this prior to storing letters in the dictionary. Note that the get method is used to check the empty dictionary and subsequently update the keys and counts respectively.
lettersCount = []
countLetters = []
totalCount = 0
A few empty lists are initialised for storing key and values from the dictionary as tuples and then sorting out in the required order. Also, we initiate a variable totalcount for storing the total number of all the letters. This will be later used to calculate the percentage of every letter.
for l, c in lettersDict.items():
    lettersCount.append((l, float(c)))
    countLetters.append((float(c), l))
    totalCount = totalCount + c
Here, we append the list with the tuples having key value pair. This consequently becomes a list of tuples and, therefore, we can change the order. The lettersCount list contains the key-value pairs, while the countLetters has value-key pairs.
lettersCount.sort()
countLetters.sort(reverse=True)
The sorting can now be carried out on both the lists that contain tuples. The first one sorts based on the keys while the second is sorted based on the value.
relCount = []
relCountReverse = []
labels = []
labelsReverse = []
values = []
Again, we initialise some lists that will be used for the purpose of plotting.
for L, C in lettersCount:
    relCount.append((float(C) / totalCount) * 100)
        labels.append(L)

for Cr, Lr in countLetters:
    relCountReverse.append((float(Cr) / totalCount) * 100)
        labelsReverse.append(Lr)
The above two loops evaluate the relative counts (percentage) and append the characters into appropriate lists. However, the order is changed between the two lists as it becomes apparent when these are plotted.
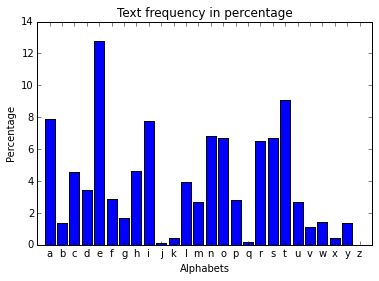
# alphabetical order
figure1 = plt.figure(1)
width = 1/1.25
plt.title("Text frequency in percentage")
plt.bar(range(len(lettersCount)), relCount, width, color="blue", align="center")
plt.xticks(range(len(lettersCount)), labels)
plt.xlim(-1, 26)
plt.xlabel("Alphabets")
plt.ylabel("Percentage")
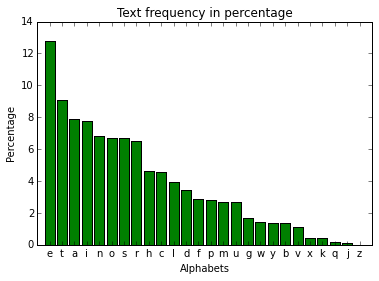
# decending order of percentage
figure2 = plt.figure(2)
plt.title("Text frequency in percentage")
plt.bar(range(len(countLetters)), relCountReverse, width, color="green", align="center")
plt.xticks(range(len(countLetters)), labelsReverse)
plt.xlim(-1, 26)
plt.xlabel("Alphabets")
plt.ylabel("Percentage")